ENROLLMENT CONTINUITY IN MEDICAID - SENIORS
The Average Senior Enrolled in Medicaid
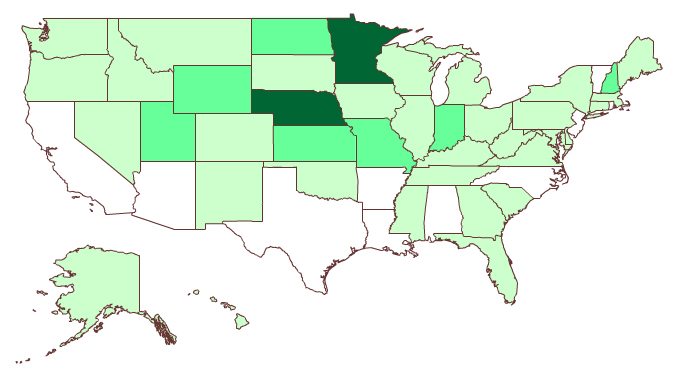
Receives Benefits Just Over Ten Months of the Year
| 10.5+ months | 10 - 10.4 months | 9.5 - 9.9 months | 9 - 9.4 months | less than 9 months |
National Average: 10.3 months
If you don't have Flash: PDF | Data Tables
The discontinuity in Medicaid coverage reported here could stem from several sources, not just “churn,” since no good measure exists to isolate “churning” rates. ACAP also supports the development of approaches to accurately measure the rate of “churn” in the program.
Average continuity was calculated by dividing the average number of monthly Medicaid enrollees in a state by its reported unduplicated total number of Medicaid enrollees and multiplying the result by 12.